The Entrepreneurship Network
February 25, 2015
Although it might look like abstract art, this image was procedurally generated by extracting information from venture capital investments.
During the fall quarter of my sophomore year (late 2012) I took Introduction to Complex Networks, a survey course in applied mathematics taught by professor Dirk Brockmann. Through his teaching, I learned about various network models and their applications. The class discussed graph theory and stochastic models, applying them to the analysis and simulation of real world network phenomena in a wide range of domains, including biology, physics, transportation, and others. When he started discussing preferential attachment processes and scale-free networks, my mind started running.
A few days later, at the end of one of his lectures, I shared an idea with my professor: the preferential attachment models we discussed in class probably applied to venture capital funding processes, and data on startup investing was publicly available online, waiting to be analyzed. Dirk was intrigued. In a matter of days I convinced my friend Leon Sasson to join me in an independent research project under Brockmann’s guidance, and we got to work. Over a six-month period, we scoped our project, used the Crunchbase API to gather data, and developed software to analyze and visualize the underlying patterns.
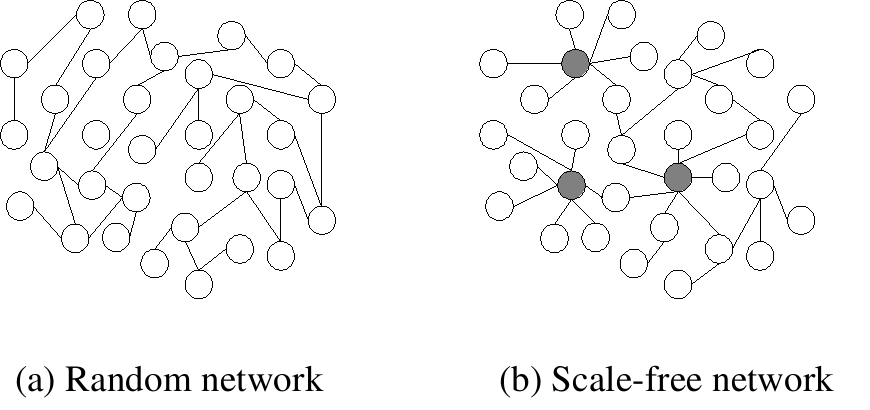 “Scale-free network sample”. Licensed under CC BY-SA 3.0 via Wikimedia Commons.
The Internet itself is probably the most common example of a scale-free network: many large hubs connect users to the smaller, lesser-known websites. The startup world, with its epicenter at Silicon Valley, seems to be a good example of this dynamic too. Our analysis provided some insight into this idea.
When we downloaded the data from Crunchbase (back in Q1 2013), there were around 30,000 funding rounds and over 280,000 profiles which included startups, employees, investors (both individual and institutional). Obviously, the technology world has evolved, and today Crunchbase holds more than twice that number of profiles and funding rounds, so the specifics in our results would probably differ significantly if the analysis were repeated with today’s data. Nevertheless, I believe our results are still interesting, and the patterns should still hold. I will summarize some key findings here.
We built separate networks for startups and investors. On the startup side, two companies were connected if they had a common investor, while investors were connected if they had funded a common company. These were basically the projections of a bipartite network onto its disjoint sets. Some basic quantities that describe the networks, such as N (number of nodes), L (number of edges), σ (network connectivity), dT and φ (network diameters), cc (clustering coefficient) and
| N | L | σ | dT | φ | cc | <k> | |
|---|---|---|---|---|---|---|---|
| Companies | 109,044 | 739,054 | 3.99x10⁻⁷ | 3.63 | 17 | 0.082 | 13 |
| Financial Organizations | 8,635 | 46,111 | 8.12x10⁻⁶ | 3.51 | 10 | 0.366 | 10 |
The main takeaway from these numbers is that for such large and sparse networks, the diameters are very small. In layman’s terms, the diameter of a network is the maximum number of steps it would take to get from a given node to any other, as in the notion of six degrees of separation. These features mean that although both networks have many nodes and links between them, and they are not very well connected, a few large hubs connect the network as a whole. This is what we would expect from networks built through preferential attachment, following a power law that leads to a scale-free pattern.
The numbers were useful in describing the networks, but we used data visualizations to help us understand the structure to a different extent. By using a technique called k-core decomposition, we showed that indeed, as we disentangled the hierarchical structure of the investor network, and progressively focused on the most connected funds at the central core, we ended up with the big names. Sequoia, KPBC, Intel Capital and others who have the resources to invest in many deals over several rounds form the big red ball found at the center of this image. Notice that this is an objective measurement of quantity of deals, not their quality. The VC world is usually characterized as an old boy’s club, and this picture seems to confirm it.
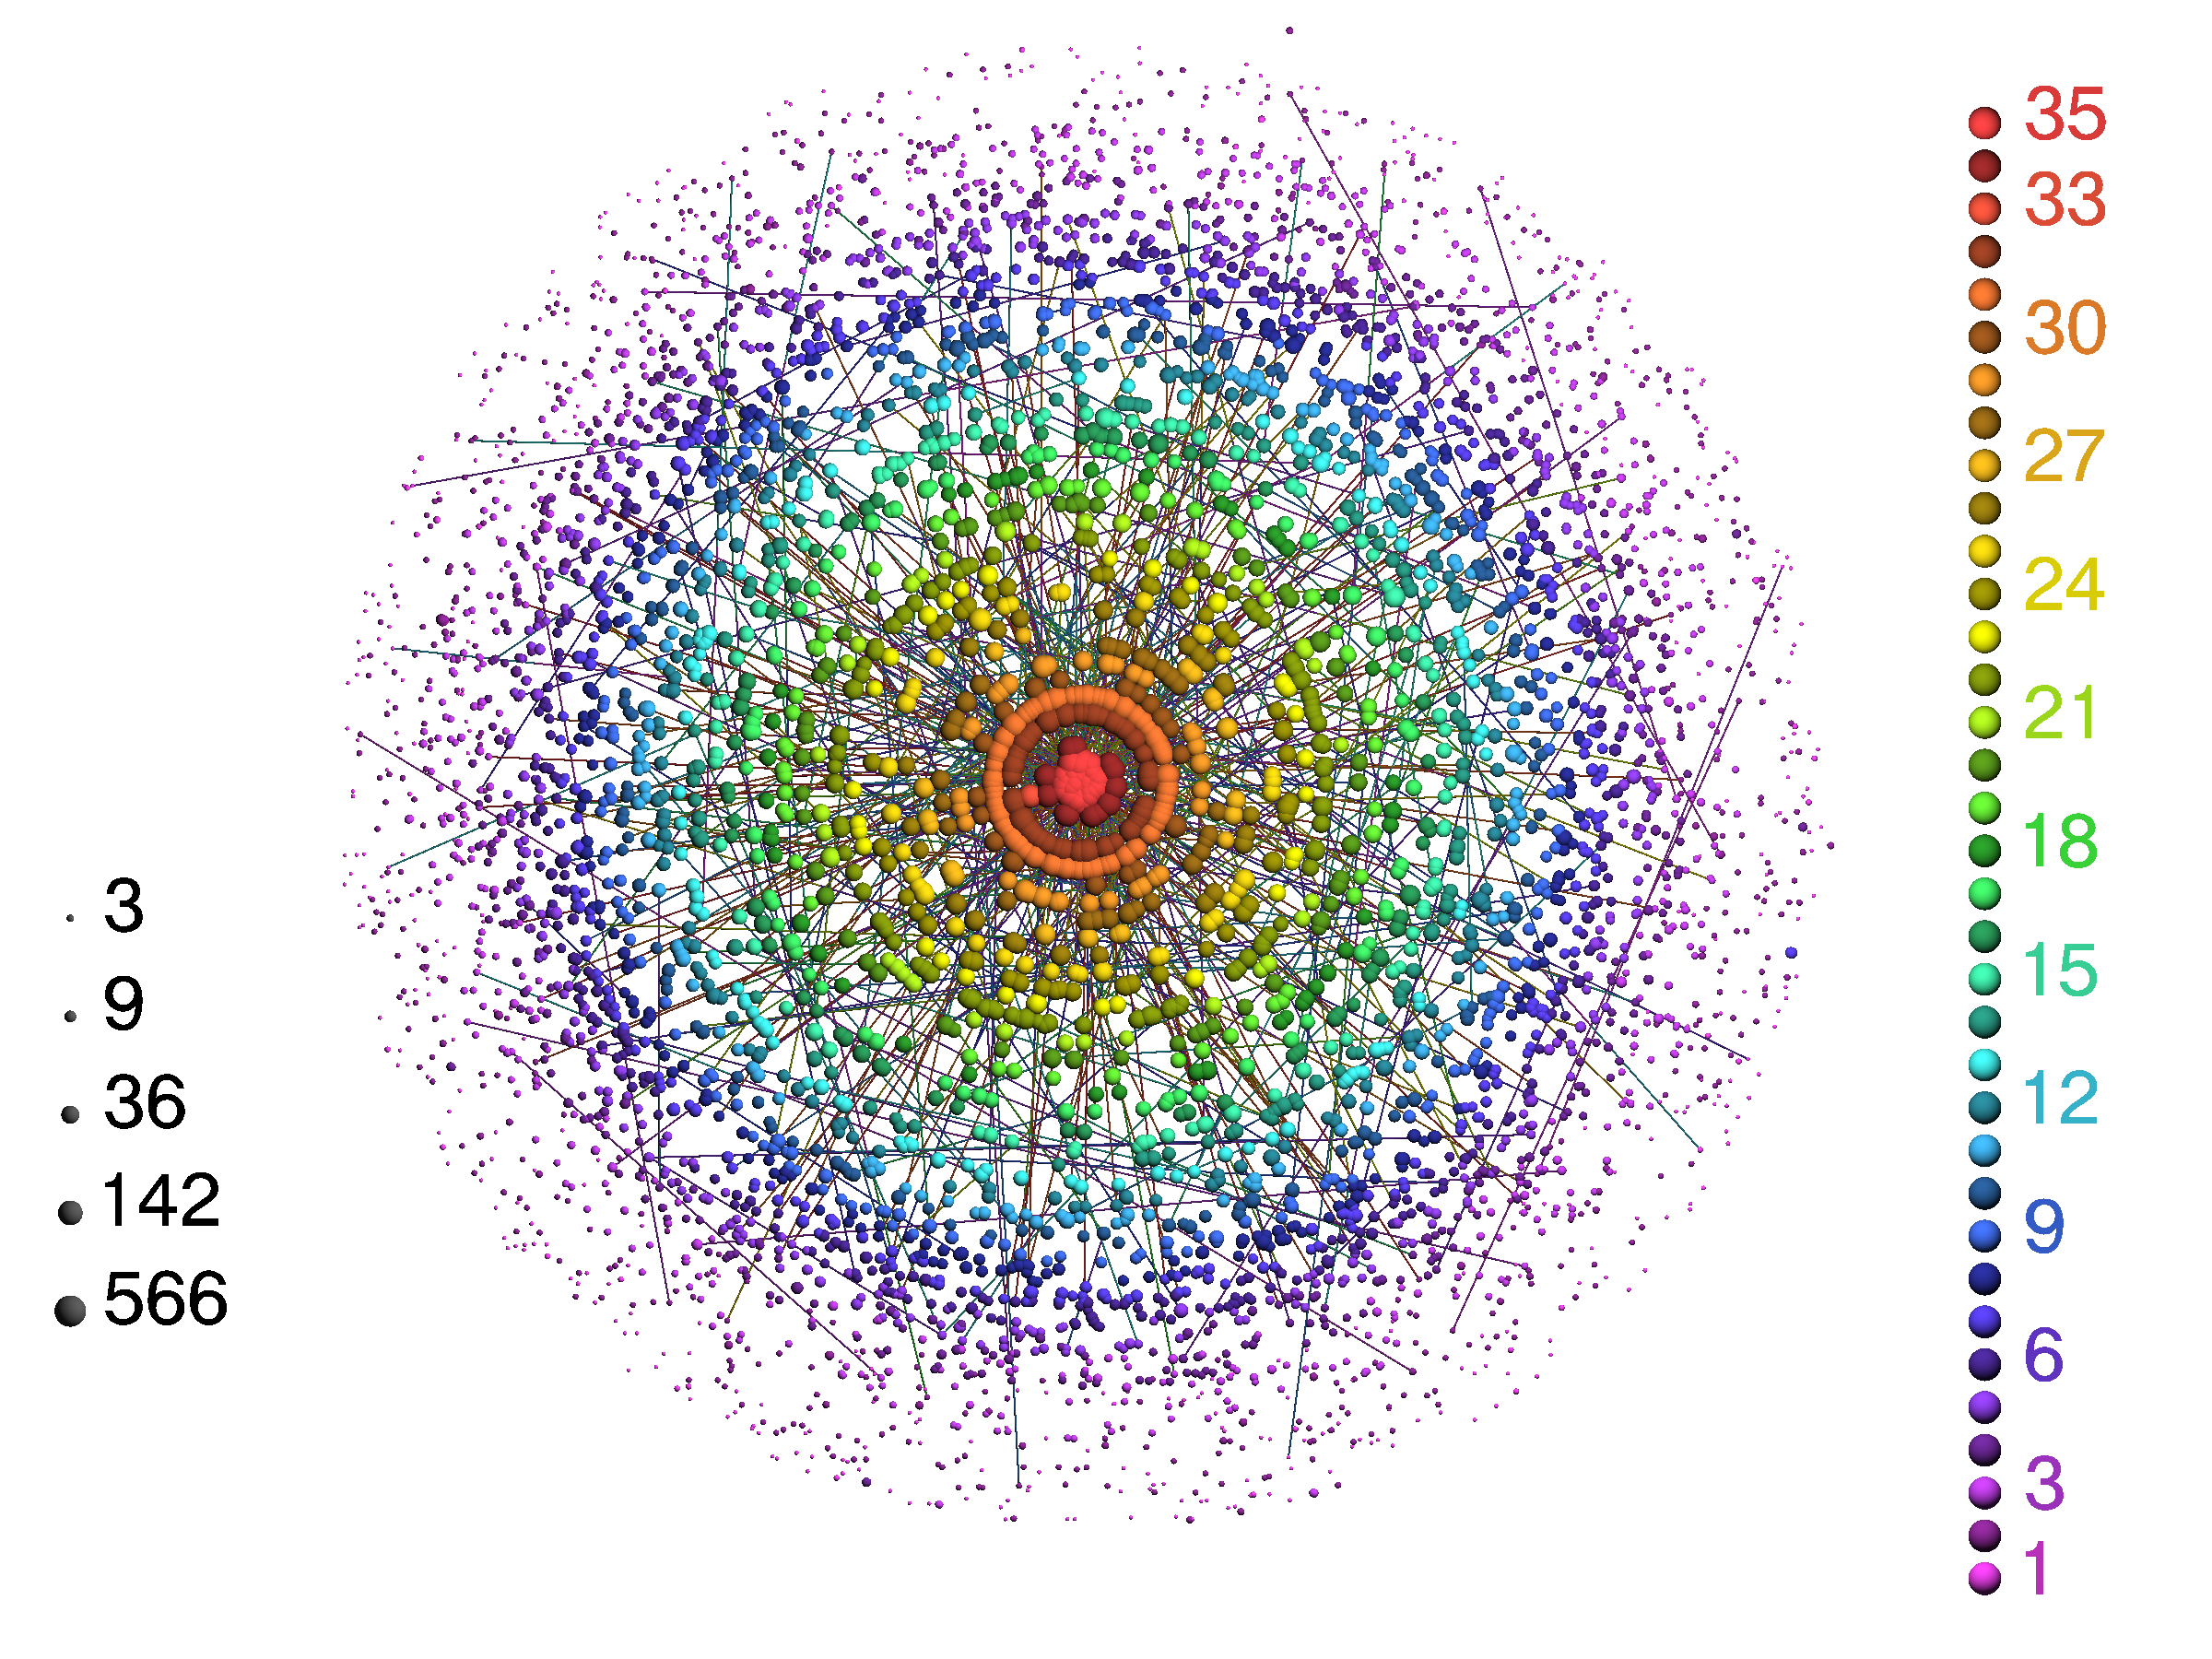 K-Core decomposition of Financial Organizations
Furthermore, we also found that companies with a high number of neighbors tend to be connected with other highly connected startups. This phenomenon, called assortative mixing, suggests that startups backed by many investors tend to get funded by those investors who fund many companies. Nevertheless, this could also be an artifact arising from the fact that, in general, larger funds get their hands on many more deals, another important dynamic in startup land.
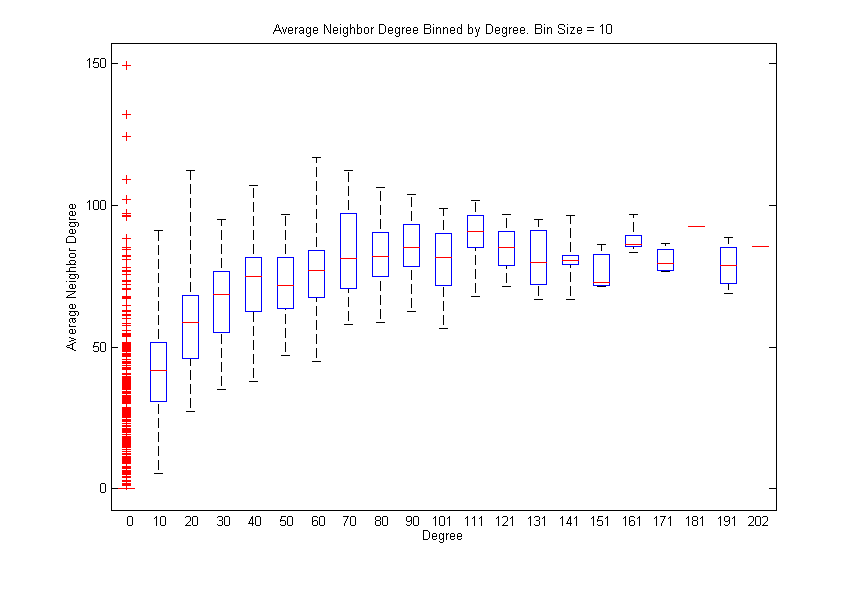 k vs. <kk> is a measure of how well-connected a startup is, compared to how well-connected its neighbors are.
After six months of working on this project we were finally getting interesting results. When we presented our results to Dirk, he was very excited with our findings, and suggested that we should develop our work into a paper to submit to scientific journals, but neither me nor Leon were interested at the time. Soon after, Professor Brockmann went on to greener pastures at the Humboldt Universität Berlin, while we decided to move on to new projects.
Perhaps Leon and I will revive our analysis at some point in the future.