Finding Communities of Collaborators in Paul Graham's Essays
March 7, 2015
In the world of startups, few people have a presence as strong as Paul Graham’s. An avid computer scientist turned venture capitalist, pg (as he is known on the news aggregator Hacker News) is also famous for his thoughtful essays, which he publishes on a regular basis on http://www.paulgraham.com, and which spawn a wide range of topics.
Almost every single article ever posted by Graham ends with a thank you note to those who discussed the topic with him, read his drafts, or somehow influenced him to write about the subject. Individually, these are just polite acknowledgements, but in aggregate, they offer a window into Graham’s personal network. The underlying assumption I will make here is that when Paul asks two people to read or review a draft of one of his essays, there is an implied relationship between the two collaborators’ expertise, and this should be somehow encoded in the data.
In this post I will try to analyze this system, and in the process explain how one can infer community groupings from the link structure in such a collaboration network.
(TL;DR, here is the full image )
Getting the data
To start the analysis, I wrote a quick python script that scrapes all the articles posted on the site, searched for strings starting with “Thanks to “ and extracted the names that followed. This quick heuristic outputs a csv file where each row represents an essay, including its title and the group of collaborators listed. Naturally, the scraper made mistakes. Since Graham’s writing doesn’t always follow the exact same format, some manual clean up was required, too. For example, names and nicknames had to be joined by hand (i.e., I had to tell the program that Mike and Michael Arrington are indeed the same guy).
Armed with clean data, we can continue to the fun stuff. I will do my best to limit the math and the code, and show the concepts behind the algorithms instead.
Lets build pg’s network.
We will start by building a network of essays and collaborators, and then use that network to produce what we are really looking for: a network that links collaborators to each other based on which essays they are co-listed in. The final goal is to find which of pg’s collaborators tend to help him in similar essays, inferring “communities” of collaborators.
Generally, networks are expressed as tables, or adjacency matrices, where rows and columns represent nodes. For the uninitiated: the words graph and network are used interchangeably to describe the system as a whole, while links and edges refer to connections between the nodes.
To build the network, I created a node for each row in the essays data set, and as I iterated over the essays I added nodes and links for the contributors that correspond to each one.
In pseudo-code, this means that:
For Essay in Essays:
	Add Essay to the Network
	For Person in Essay.Contributors:
		Unless Person already in Network:
			Add Person to the Network
		Add link(from: Person, to: Essay) to the Network
And that’s it! Now the network links all of the essays to their contributors, but there is one more step, since we want to link contributors to each other. Here is where the dual nature of the network kicks in to help.
Bipartite matrices and projections
By definition, the network we are studying is an unweighted, undirected bipartite graph; nodes are either essays or people. A bipartite network is a graph whose nodes can be grouped into two disjoint sets. In this case, essays, which only link to people, and people which only link to essays.
We will exploit a property of this kind of graph that allows us to easily relate pairs of collaborators through the essays they have in common, by projecting the network onto the set of collaborators. This can be explained with some fancy math, but basically we count the number of times a pair of collaborators appear together, and we produce a new matrix that bakes this information into the importance of its links.
Ok, done with the math. Back to pg.
Using a python library called Networkx we can quickly compute pg’s W matrix, which we then can plug into Gephi, and run its layout algorithm to get this:

We’re getting there, but the picture we have so far is not very useful, and the network structure is not telling us anything yet.
Well, a bit more math…
Remember that the end goal was to find subsets of people who help Paul with his essays before they are published, grouping them by which essays they appear in. We’ll need some math to get these groups sorted out.
To accomplish this, we will try to assign groups in such a way that we maximize the graph’s modularity. I won’t explain the metric in detail, but basically it amounts to how interconnected the members of each group are to each other. A high modularity shows that there are significantly more links between individuals of the same groups than when compared to a scenario where a node’s links are placed randomly across the network.
Gephi maximizes modularity for us at the press of a button, using a complicated formula. I don’t find this too intuitive, so I’ll show a different way of solving this problem through a randomized process, even if it is not as efficient.
We start at time t=0 with each node assigned to its own group, and compute the current modularity Q0. We randomly select a node N, and we randomly update its group. We calculate modularity again, and if Q1 > Q0, we permanently set N’s group to its new value. Otherwise, we maintain the previous groupings. This process is repeated a predetermined number of times T, eventually maximizing the value of Q.
In pseudo-code, this is basically:
Assign each node to its own group
Compute modularity Q_0
Select number of timesteps T
For t in T:
	Select random node N
	Select random group G
	Assign N to G
	Compute modularity Q_t
	If Q_t-1 > Q_t:
		Reset N's group to its previous group
We let the algorithm run for a while, and we get groups! Since this algorithm is in the family of hill climbing heuristics, the clusters we find are not necessarily optimal, but only an approximation. Even the final number of groups is random, and can change on each run of the algorithm, but for our purposes this is good enough.
The Graph
To better understand the graph, we will give each group its own color. Furthermore, we will resize each node in relation to how many other nodes its connected to, a metric known as degree centrality. On this run, I ended up with 4 groups. When running clustering algorithms, it is always hard to tell what each group represents, but here are my guesses:
Red: Investors
With plenty of Y Combinator partners, plus Fred Wilson, Marc Andreesen, Ben Horowitz, Chris Dixon, Mike Moritz, among others, this one seems to be pretty clear. 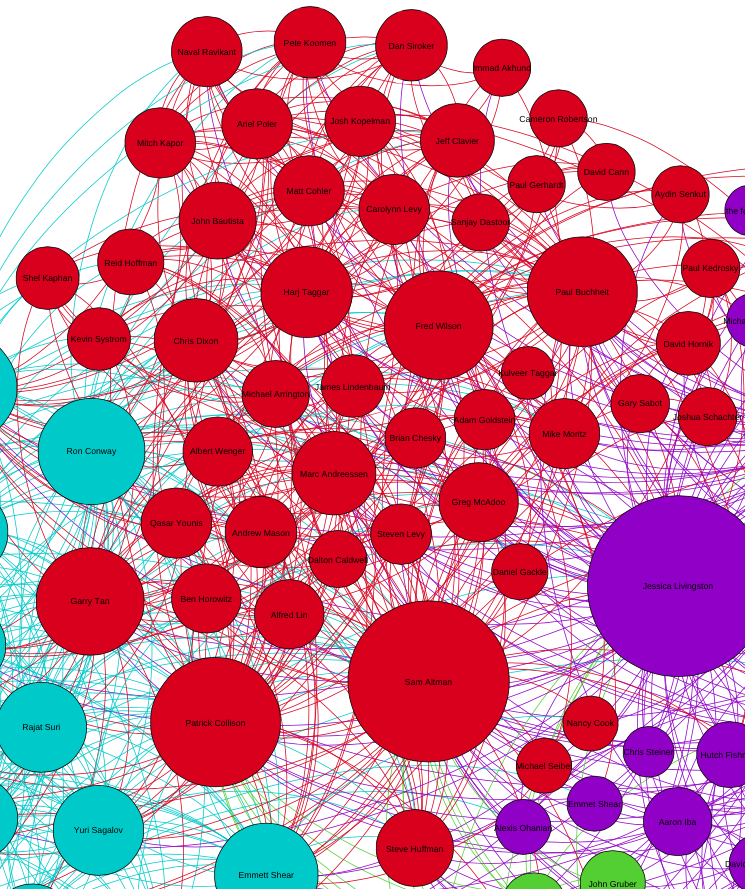
Teal: Startup Founders
This one is a little bit trickier. Joe Gebbia, Kevin Hale, John Collison, Jason Freedman, etc. Most people in this cluster are founders of YC startups, but some of them have transitioned and now are part of YC as well. Somehow, Geoff Ralston and Ron Conway trickled in here, but they are clearly closer to the red group. 
Purple: Early Collaborators/CS Academics
The content of pg’s essays have changed over time, and the purple cluster seems to be picking up on his early collaborators: Jessica Livingston, Robert Morris, Trevor Blackwell, and Dan Giffin have been reading Paul’s essays all along, and that brings them together in this group. Even his dad is included! Nevertheless, with people like Guido van Rossum, Matz, Steven Wolfram, Peter Norvig, and “several anonymous CS professors,” this group definitely has a strong computer science flavor. 
Green: The blip
And here, the experiment breaks down. Most people in this group have not really helped pg in many of his essays, and they are not very well connected to others in the graph. Maybe if we ran the modularity algorithm again this group would not be present, and its nodes absorbed by other. 
Update: removing nodes that appear once
After posting my article, and tweeting about it, I got an email from pg saying that at a glance the groupings were ~70% right. Not bad for an unsupervised algorithm! He suggested that I should remove anyone who has only collaborated with him once, and this is the graph that popped out when I did that:

The fact that there are so few data points makes the modularity algorithm too conservative. In my opinion, this a more robust but less interesting visualization.
Conclusion
Networks are cool. By using this simple modeling tool, we got to pick up a lot of latent information, and by making simple additions we could improve our understanding even more. For example, we could produce the same analysis focusing on topic modeling for the essays, based on this clustering technique but projecting in the opposite dimension.
Alternatively, we could also model the network dynamically, visualizing the network at each time step and seeing it evolve over time. This would allow us to see how the subjects pg focuses on change over time, from computer science and philosophy to business and startups.
As it stands, this analysis is mostly a curiosity, but Paul’s close relationship with his wife, Jessica, his protegé, Sam Altman, and his close business partners were all easily inferred with the degree centrality approach seen above. For better or for worse, Graham’s brilliant insights into the startup ecosystem (as influenced by the groups of people described above) have gained him an almost cult-like following. After this little project, I am thinking that maybe I am part of the cult too.
Last but not least: Thanks to Hannah Doherty, Max Faingezicht, Jonathan Maduro, Leon Sasson and Paul Graham himself for reading drafts of this, and Mike Leonard for helping with the data cleanup. Also, thanks to Dirk Brockmann for getting me interested in Complex Networks. Most of the math and code above is derived from the notes I took in his course